VIS Query

This query is used to draw any visualization (charts). A user can use * for using VIS query in all the logs. For use in specific logs, first filter it out and use the VIS query.

Note: VIS query will work only on charts, not on search.

Syntax:

*|VIS <Function name(parameters)>by<Field name [sortBy order= Ascending/Descending size=<value> customLabel=”name”]>

Example 1:

tier:updated|VIS Count() by @timestamp[interval=Auto]

Description:

Here, the tier is filtered out and then it calculates the count on that particular tier with respect to timestamp.

Output:

Figure 51: VIS Query

Example 2: tier: updated|VIS Count () by @timestamp[interval=Auto],resptime[]

OR 

tier: updated|VIS Count () by @timestamp[interval=Auto],resptime[sortBy=1 order=Ascending Size=5]

Description: Here, the user can use multiple buckets as per the usage.

Output

Figure 52: VIS Count

Syntax: *|VIS <aggregation_name>(fieldname) by @timestamp[interval=Auto]

Different Supported Aggregations along with keywords:

  • Count (): It provides the count of documents.
  • Average (): It provides the average value with respect to time.
  • Min (): This column displays the minimum value of the data sample of the metric.
  • Max (): This column displays the maximum value of the data sample of the metric.
  • Color (): This column displays the color of the metric.

Note: This column will not come for data and label widget.

  • StdDev (): It will display the standard deviation of the data sample of the metric.
  • Last (): This column displays the last value of the data sample of the metric.
  • Time Series (): This column displays the count of metrics involved to create the current aggregated metrics.
  • Metric Name (): This column represents the metric name.

Example 3: tier:updated|VIS Average(resptime) by @timestamp[interval=Auto]

Description: To perform an operation on a particular field.

Output

Figure 53: VIS Average (resptime)

A user can also provide custom label in VIS query to change/modify the label of columns and rows as per requirement. It is applicable for charts.

For count: *|VIS count(customLabel=query_count) by server[size=5 order=Descending orderBy=1 customLabel=server]

For others:*|VIS Average(resp_time customLabel=query_count) by server[size=5 order=Descending orderBy=1 customLabel=server]

Note: ‘customLabel’ does not support space in label name.

Range query in Visualization

User can also search a range query from the query bar. Below is the syntax along with an example to illustrate this feature.

Syntax: *|VIS Aggregation() by range(field_name[])

Example *|VIS Count() by range(log_message.reqLen[(0-100)])

Description: After successful execution of the query, results are displayed in the below format.

Figure 54: VIS count

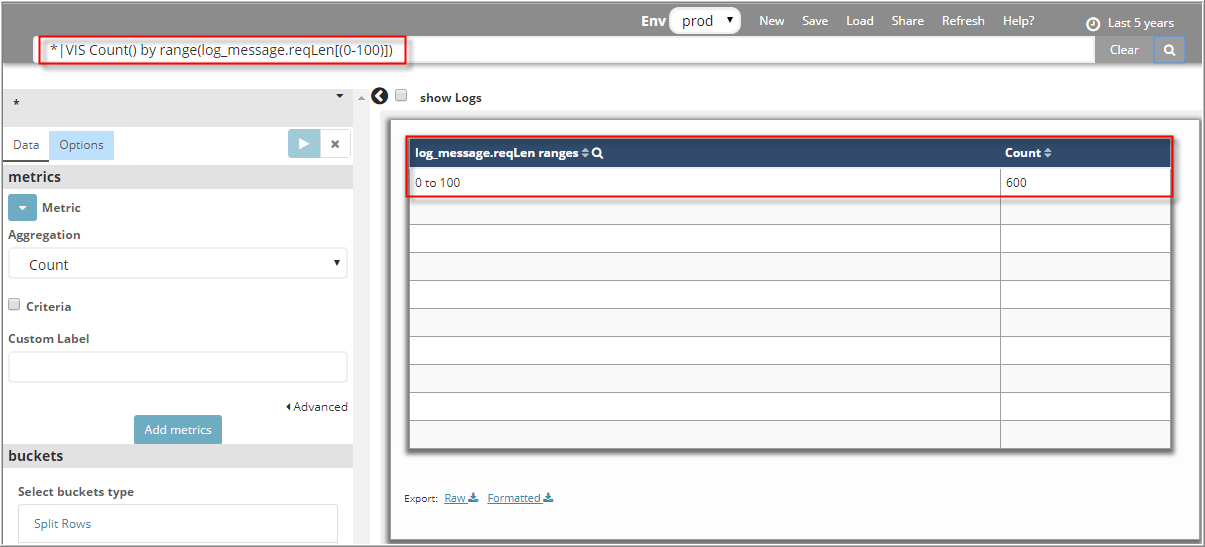
If user leaves the range empty, the default range values 0-1000 and 1000-2000 are used to display the results.

Stats Query

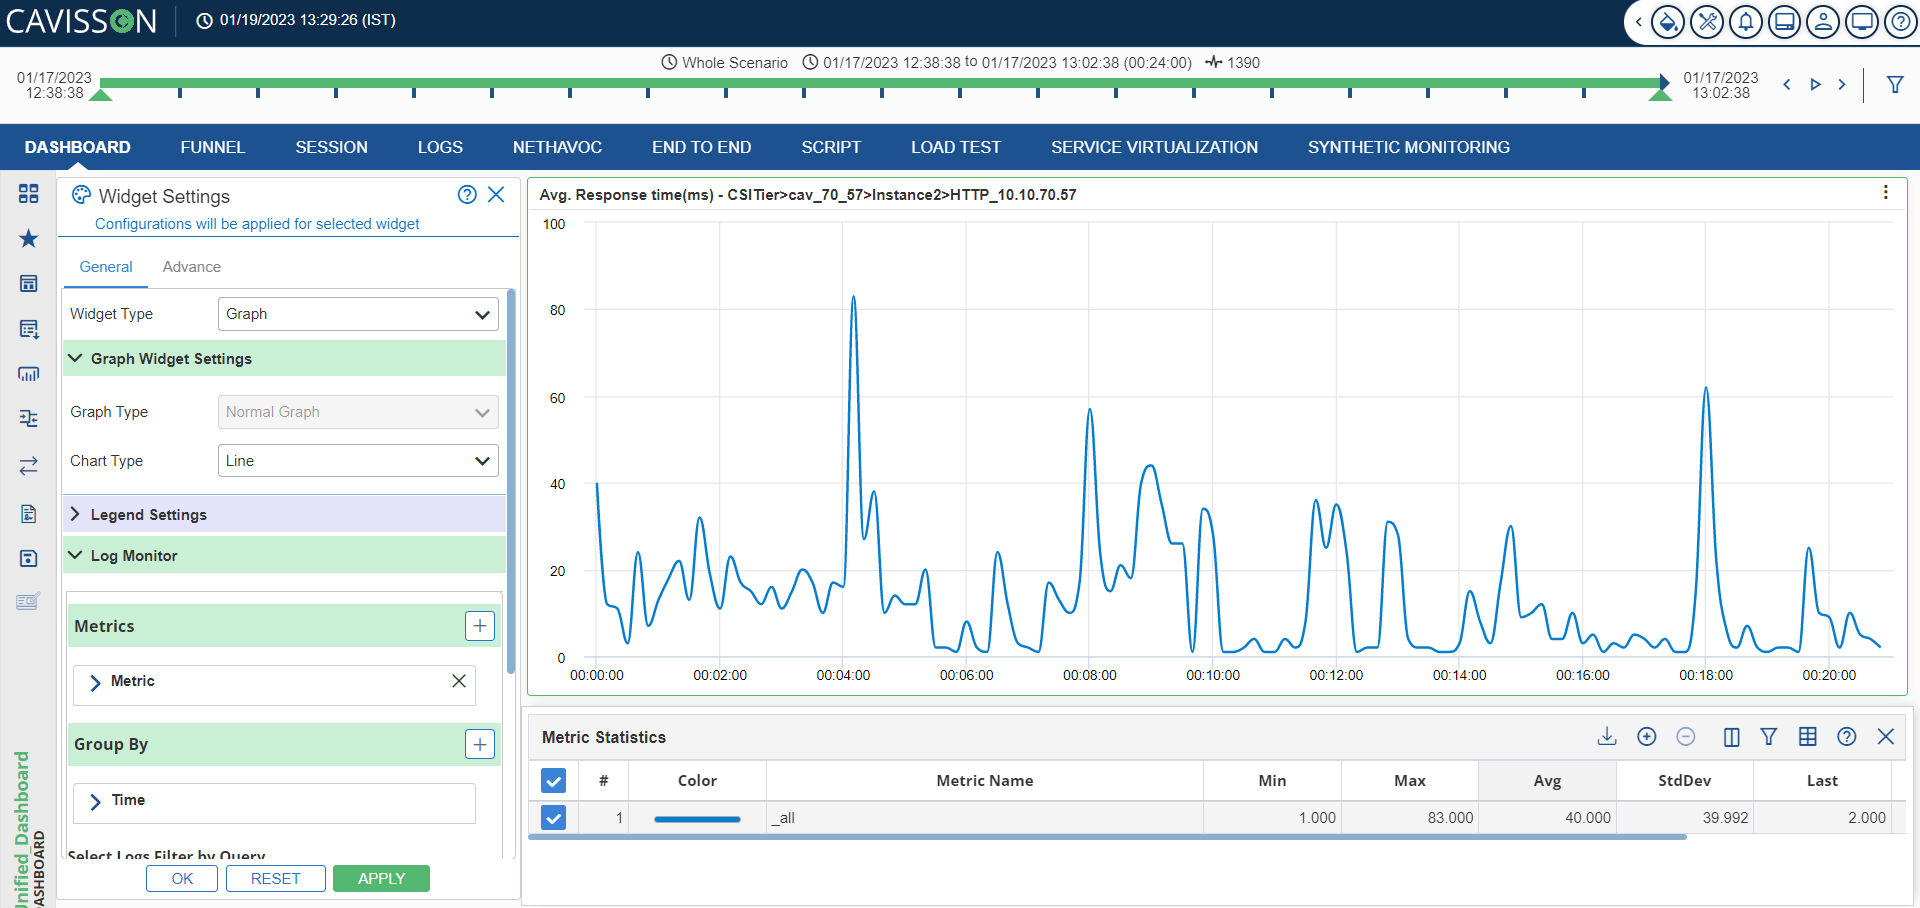
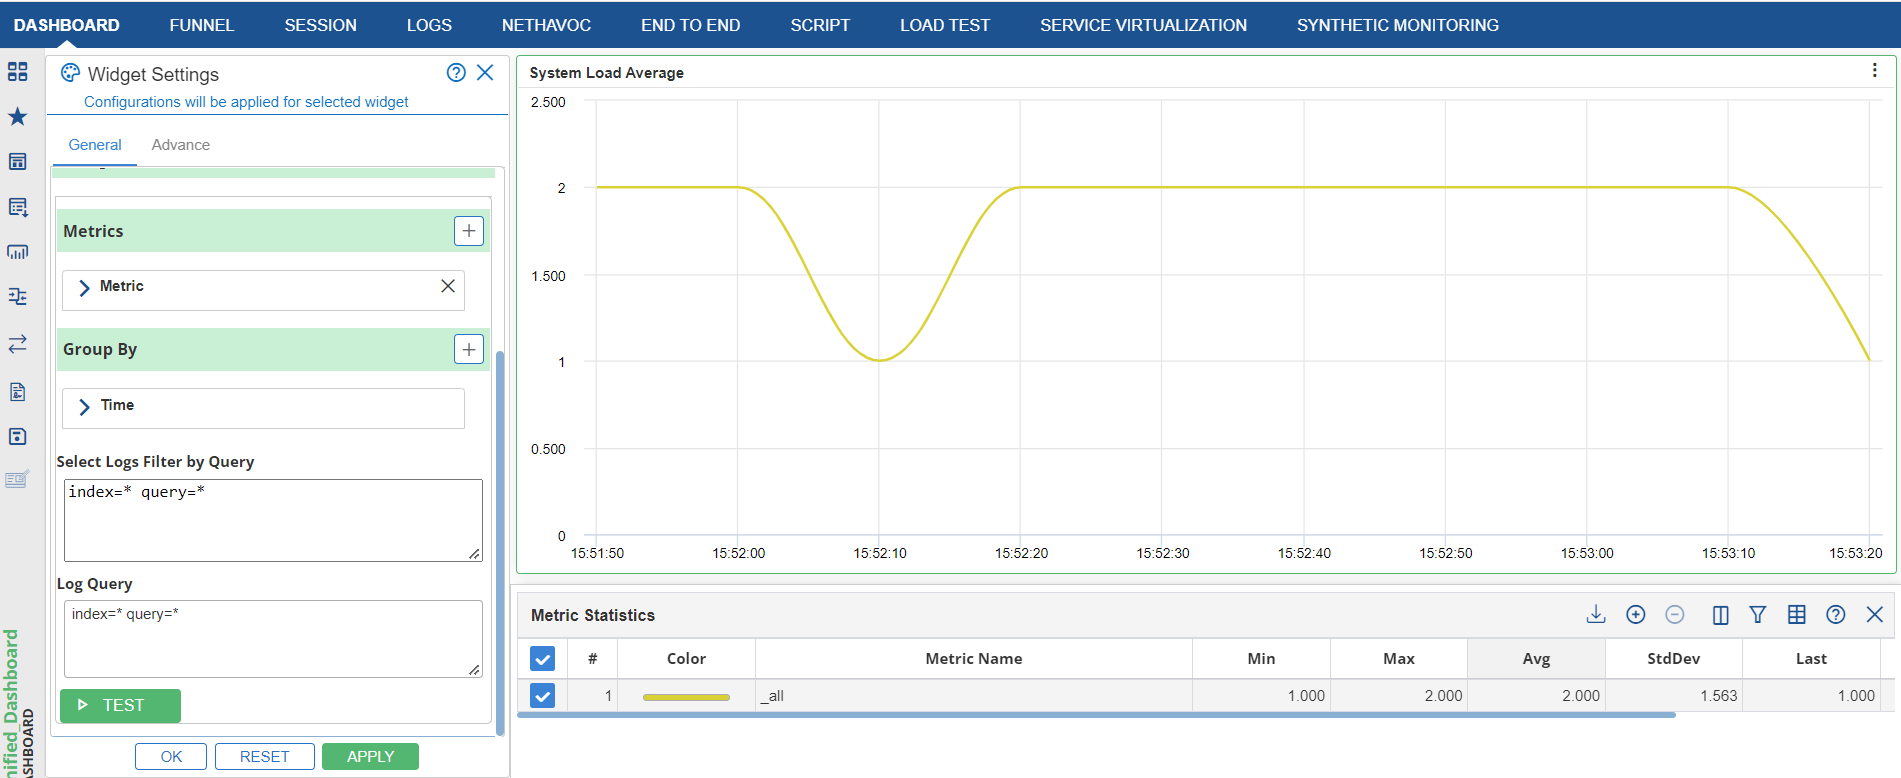
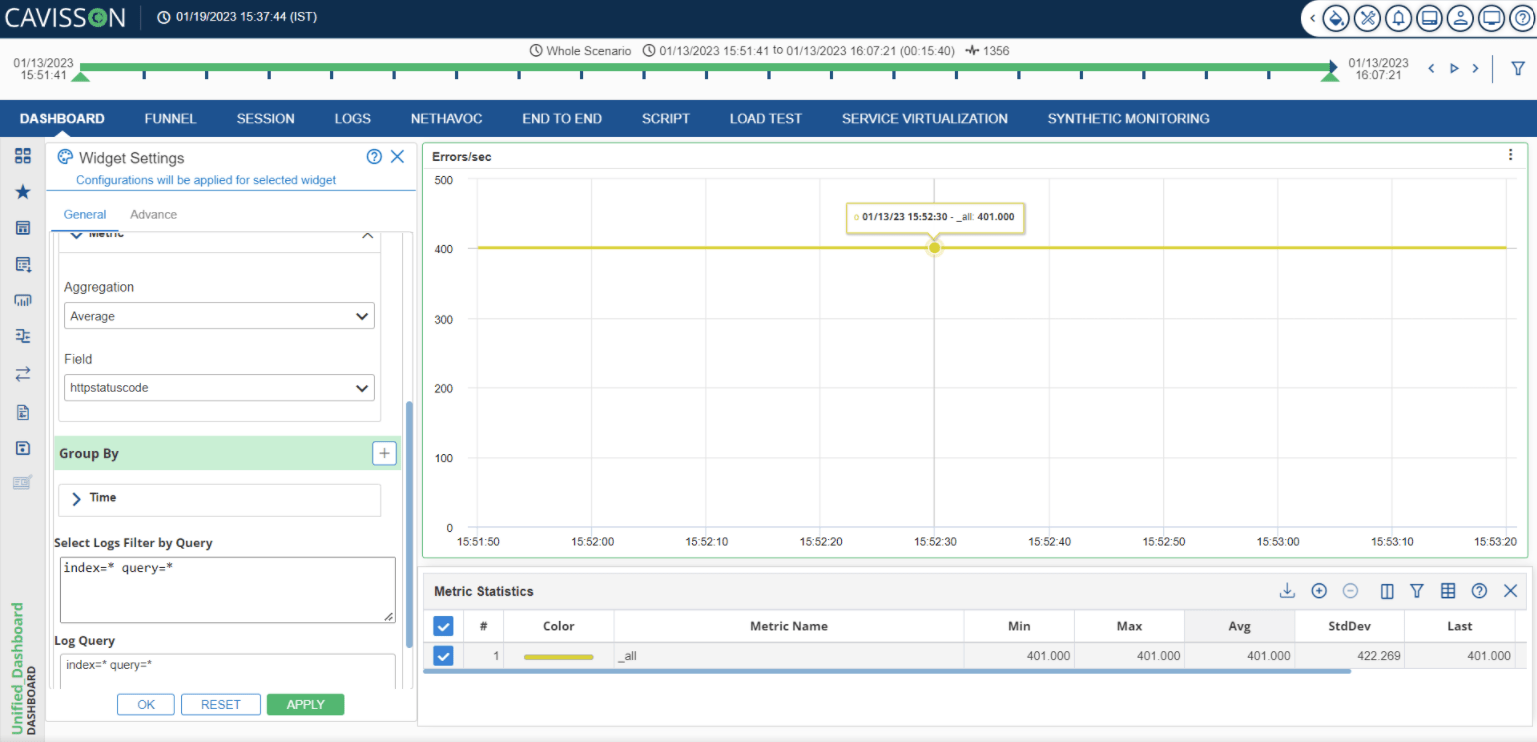
This query is used to find the statistics/aggregation for the field, such as sum, count, avg, min, max. It can be grouped by another field.

Different Supported Aggregations along with keywords:

distinct_count(Y)

Returns the count of distinct values of the field Y. 

perc(Y)

Percentiles show the point at which a certain percentage of observed values occur. For example, the 95th percentile is the value that is greater than 95% of the data.

sumsq(Y)

Returns the sum of the squares of the values of the field X.

var(Y)

Returns the sample variance of the field X.

stdev(Y)

Returns the sample standard deviation of the field X.

earliest(Y)

Returns the earliest seen occurrence of the value of field Y based on timestamp

Latest(Y)

Returns the latest seen occurrence of the value of field Y based on timestamp.

min(Y)

Returns  minimum value of the numeric field Y.

max(Y)

Returns maximum value of the numeric field Y.

count(Y)

Returns total number of occurrences of the filed Y. 

Avg(Y)

Returns average value of the field Y.